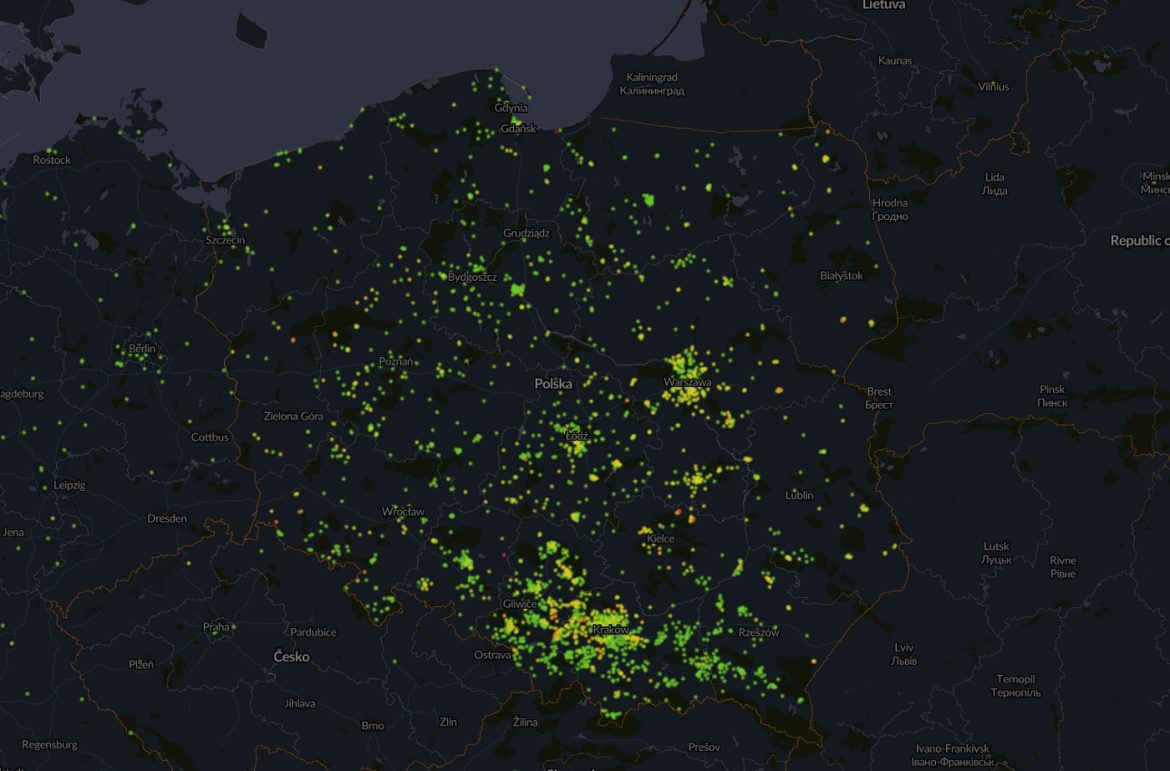
Air quality map serve as crucial tools in assessing and understanding the pollution levels within a particular area. These maps provide comprehensive visual representations of air quality data, enabling individuals, communities, and governing bodies to grasp the extent of air pollution.
By utilizing advanced monitoring technologies and data visualization techniques, air quality maps offer valuable insights into the distribution and concentration of pollutants in the atmosphere. This guide aims to explore the importance of air quality maps, their interpretation, and their implications for environmental awareness and public health.
Understanding air pollution in urban areas through air quality map
In urban settings, air quality maps play a pivotal role in highlighting the presence of smog and other harmful pollutants. Cities often experience heightened levels of air pollution due to industrial activities, vehicular emissions, and urbanization. Air quality maps depict the severity of pollution hotspots, enabling policymakers and urban planners to identify areas in need of immediate intervention. Moreover, these maps raise awareness among residents about the potential health risks associated with poor air quality, prompting individuals to take proactive measures to mitigate exposure.

Empowering individuals with respiratory conditions through air quality map
For individuals living with respiratory ailments such as asthma or chronic obstructive pulmonary disease (COPD), air quality maps serve as invaluable resources for managing their health. By accessing real-time air quality data through online platforms or mobile applications, individuals can make informed decisions regarding outdoor activities and medication usage. Furthermore, air quality maps provide insights into pollutant trends and fluctuations, allowing vulnerable populations to take proactive measures to minimize exposure to harmful air pollutants.
Utilizing air quality map for environmental governance and policy implementation
Local authorities and governmental agencies rely on air quality map to formulate effective environmental policies and regulations. By analyzing spatial patterns of air pollution, policymakers can implement targeted measures to reduce emissions and improve air quality standards.
Additionally, air quality maps facilitate the monitoring of compliance with environmental regulations and the assessment of the effectiveness of mitigation strategies over time. Through collaborative efforts between government agencies, scientific institutions, and community stakeholders, air quality maps contribute to the sustainable management of air resources and the protection of public health.

Harnessing the power of air quality map for a healthier environment
In conclusion, air quality map play a vital role in enhancing environmental awareness, protecting public health, and guiding policy decisions at local, regional, and global levels. By harnessing the power of technology and data visualization, these maps empower individuals and communities to take proactive steps towards reducing air pollution and fostering a healthier environment for future generations.
As we continue to face environmental challenges exacerbated by urbanization and industrialization, the significance of air quality maps in promoting environmental sustainability and human well-being cannot be overstated. Let us leverage these valuable tools to drive positive change and ensure a cleaner, safer world for all.
Author Profile
Latest entries
 Electricity & ElectronicsFebruary 17, 2026Precision Engineering and Reliability in Industrial Power Transmission
 TechnologyJanuary 18, 2026Working at Height: Why Reliable Fall Protection Is Non-Negotiable
 Home & GardenNovember 18, 2025Finestre moderne: design, funzionalità e soluzioni innovative
 Health & BeautyJune 28, 2025Rehabilitační pomůcky nové generace: pohodlí a funkčnost v jednom