Understanding air quality maps: an introduction to real-time pollution monitoring
Air quality maps have become indispensable tools in the fight against air pollution. These interactive maps provide real-time data on various pollutants present in the atmosphere, allowing users to monitor pollution levels in their area with unprecedented accuracy. By visualizing complex data in an accessible format, air quality maps empower individuals, communities, and policymakers to make informed decisions to protect public health and the environment.
The importance of air quality map: combatting smog in urban areas
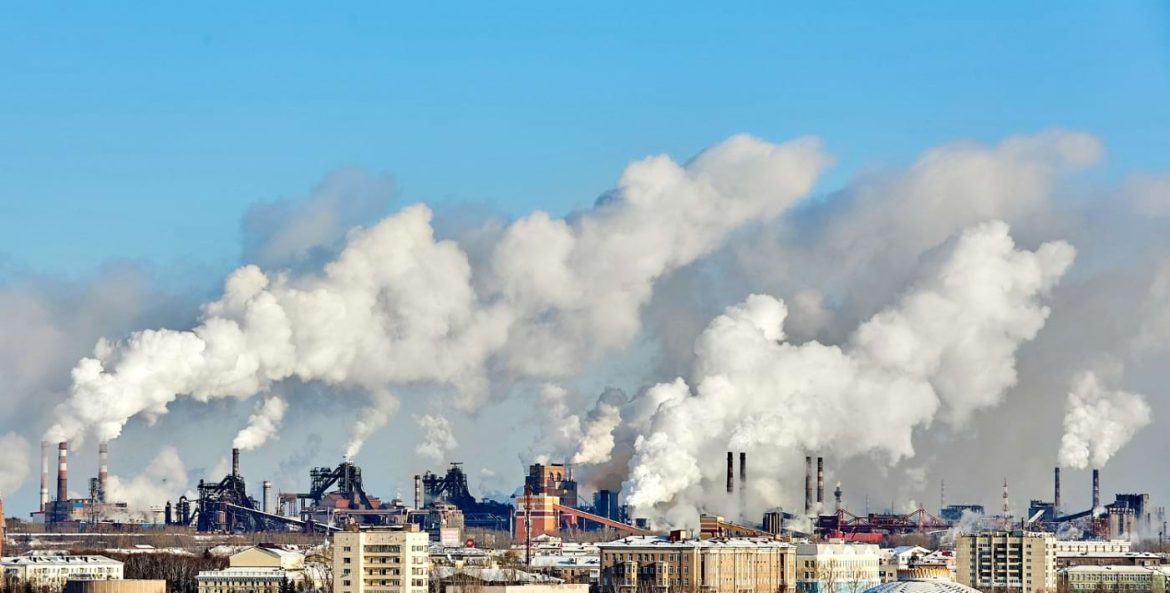
In urban areas around the world, smog has become a pressing environmental and public health concern. Smog, a type of air pollution, is characterized by a mixture of pollutants such as particulate matter, nitrogen oxides, volatile organic compounds, and ozone. Prolonged exposure to smog can lead to respiratory problems, cardiovascular diseases, and other serious health issues. Therefore, continuous monitoring of air quality is essential to identify smog hotspots, implement targeted interventions, and mitigate its harmful effects on human health and the environment.

Unveiling the causes of smog: insights into pollution sources
To effectively combat smog, it is crucial to understand its underlying causes. Industrial activities, vehicular emissions, agricultural practices, and energy production are among the primary contributors to air pollution. Additionally, meteorological factors such as temperature inversions and stagnant air masses can exacerbate smog formation by trapping pollutants close to the ground. By analyzing air quality data and identifying pollution sources, stakeholders can develop strategies to reduce emissions, improve air quality, and safeguard public health.
Air quality map: collaborative efforts by municipalities and companies
Air quality monitoring involves the collection, analysis, and interpretation of vast amounts of data from various sources. Government agencies, environmental organizations, research institutions, and private companies deploy networks of air quality sensors across different geographical areas to gather comprehensive data on pollutant concentrations. These data are then processed and visualized on air quality maps, providing valuable insights into pollution trends, hotspots, and potential health risks. Collaborative efforts between municipalities and companies play a crucial role in maintaining and expanding these monitoring networks to enhance data accuracy and coverage.

Empowering communities: utilizing sensor data for cleaner air
The widespread availability of air quality sensor technology has empowered communities to actively participate in air quality monitoring initiatives. Citizen science projects engage volunteers in data collection efforts, allowing them to contribute to environmental research and advocacy. Mobile apps and online platforms provide access to real-time air quality map, enabling individuals to make informed decisions about outdoor activities, transportation routes, and health precautions. By harnessing the collective power of citizen scientists, communities can amplify their voices, advocate for cleaner air policies, and drive positive change at the local level.
Towards a greener future: innovations in air quality management
As awareness of air pollution’s detrimental effects grows, so does the demand for innovative solutions to address this global challenge. Technological advancements such as low-emission vehicles, renewable energy sources, and green infrastructure offer promising opportunities to reduce pollution levels and improve air quality. Additionally, smart city initiatives integrate air quality map with urban planning and transportation networks to create healthier and more sustainable communities. By embracing these innovations and implementing evidence-based policies, we can pave the way towards a greener future where clean air is accessible to all.
Author Profile
Latest entries
 Electricity & ElectronicsFebruary 17, 2026Precision Engineering and Reliability in Industrial Power Transmission
 TechnologyJanuary 18, 2026Working at Height: Why Reliable Fall Protection Is Non-Negotiable
 Home & GardenNovember 18, 2025Finestre moderne: design, funzionalità e soluzioni innovative
 Health & BeautyJune 28, 2025Rehabilitační pomůcky nové generace: pohodlí a funkčnost v jednom